
Analytical Paragraph Class 10: Format, Phrases and Solved Examples
An analytical paragraph turns the numbers in a chart into clear, well-ordered sentences, and it is a regular question in the CBSE Class 10 English paper. This page explains what an analytical paragraph is, the format examiners expect, the phrases that make your answer sound polished, and six solved examples based on a bar graph, a line graph and a pie chart.
Read the guide once, then study the examples with the chart above each one. Notice how every answer opens with the source, moves through the main figures in order and closes with a short conclusion. Finish with the practice questions at the end, and time yourself: a good answer takes about 10 minutes.
What Is an Analytical Paragraph? Format and How to Write It
An analytical paragraph is a short, factual description of data shown in a chart, graph or table. In the writing section of the CBSE Class 10 English exam, you are usually given a bar graph, line graph, pie chart or table and asked to write about it in 100 to 120 words. It is not a set question in the Class 9 board syllabus, but many schools practise it with simpler charts in Classes 8 and 9. Your job is to report what the figures show, point out the main trends and compare the important numbers. You are a reporter here, not a critic, so keep personal opinions out except for a brief remark at the end.
Analytical Paragraph Format
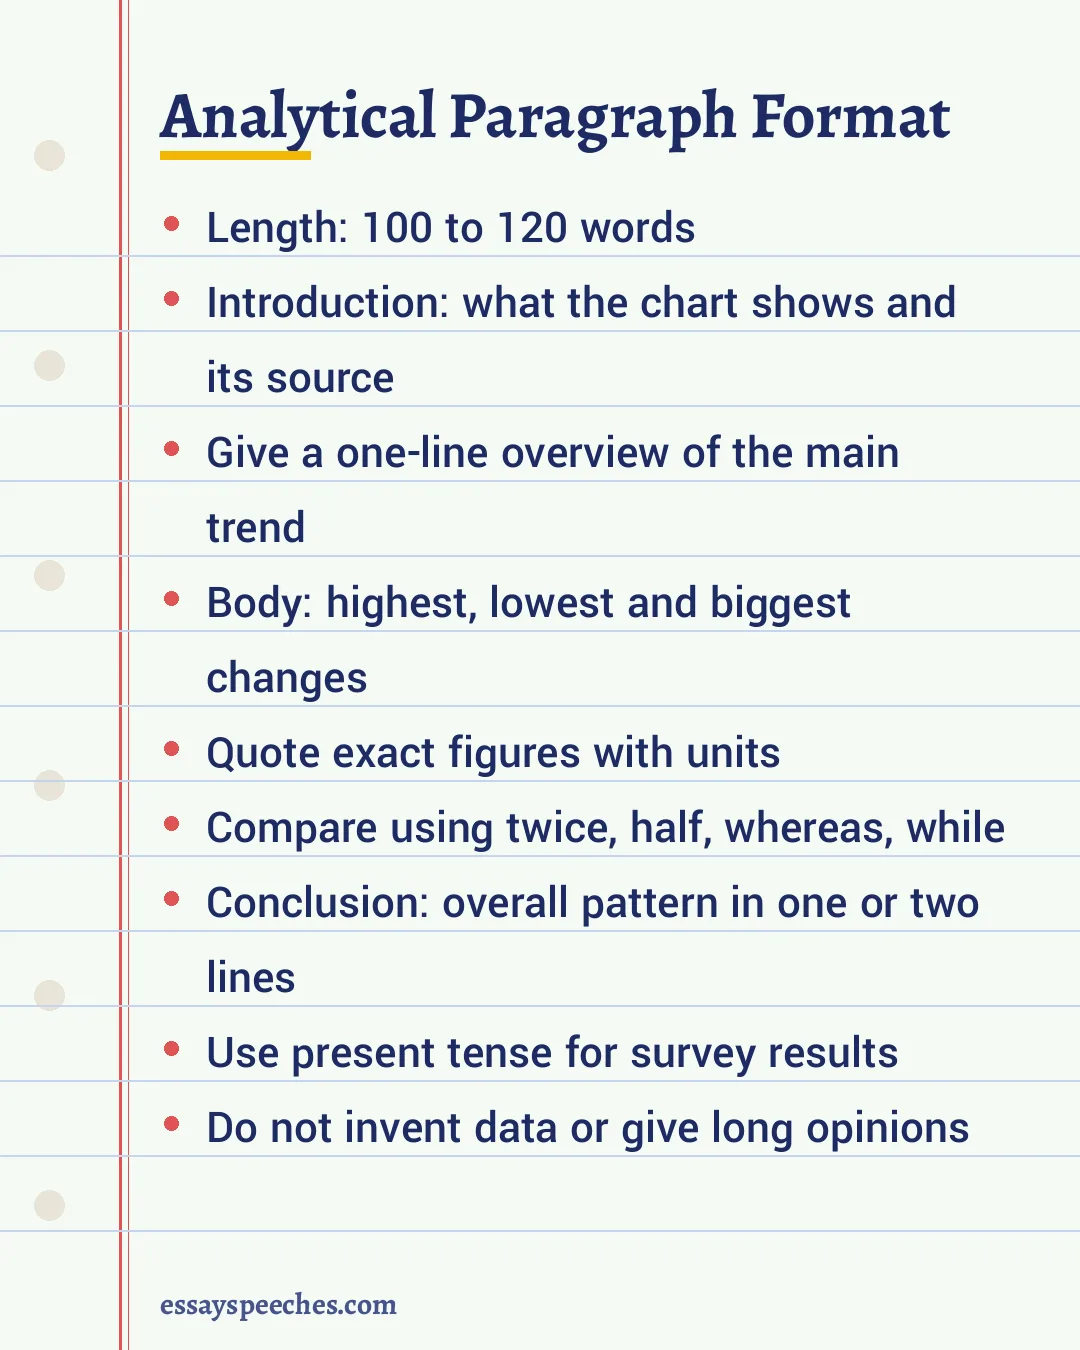
- Introduction (1 or 2 sentences): Say what the chart shows, who or what was surveyed, the place and the time period. Then give a one-line overview of the biggest trend, for example "Overall, screen time rises sharply at the weekend."
- Body (4 to 6 sentences): Describe the key figures in a sensible order: from highest to lowest, or from the first year to the last. Quote exact numbers with their units (percent, hours, litres) and compare them.
- Conclusion (1 or 2 sentences): Sum up the overall pattern. If it fits, add a likely reason or a short suggestion drawn from the data.
A title is not compulsory. Some teachers like a short one, so follow your teacher's instruction. Write the answer as one paragraph, not as points.
Marking Points in CBSE-Style Exams
- Format: a clear introduction, body and conclusion within the word limit.
- Content: correct figures, all the main features covered, nothing invented or left out.
- Organisation: a logical order of ideas joined with linking words such as however, while and similarly.
- Accuracy and fluency: correct grammar, spelling and tense, with varied words for rise, fall and comparison.
How to Write an Analytical Paragraph in 6 Steps
- Read the title, the labels and the units of the chart carefully.
- Mark the highest figure, the lowest figure and the biggest change.
- Group items that behave alike, such as two categories that both fell.
- Write the introduction with the source and an overview line.
- Write the body in order, using at least two comparisons.
- Close with a conclusion, then check every number against the chart and count your words.
Useful Phrases for an Analytical Paragraph
| Purpose | Words and phrases |
|---|---|
| Rising | rose, increased, climbed, went up steadily, a sharp rise, reached a peak of |
| Falling | fell, dropped, declined, dipped, went down gradually, hit a low of |
| No change | remained steady, stayed constant, levelled off, showed little change |
| Comparing | twice as many as, half of, one third of, compared with, whereas, while, in contrast |
| Approximating | about, nearly, roughly, just over, just under, close to |
| Opening | The bar graph illustrates, The pie chart presents, The given data compares |
| Concluding | Overall, On the whole, To sum up, The data clearly shows that |
Dos and Don'ts
- Do use the present tense for survey results and the past tense for data about past years.
- Do round figures sensibly ("nearly half") only after you have given the exact number once.
- Do vary your verbs; "increased" five times in a row loses marks for fluency.
- Don't copy every single number. Select the important ones.
- Don't add facts that are not in the chart or write a long opinion.
- Don't go far beyond 120 words; extra words do not earn extra marks.
For the basics of topic sentences and linking ideas, see our guide to paragraph writing. For longer answers, read our essay writing format.
Analytical Paragraph Class 10 Line Graph Example: Screen Time
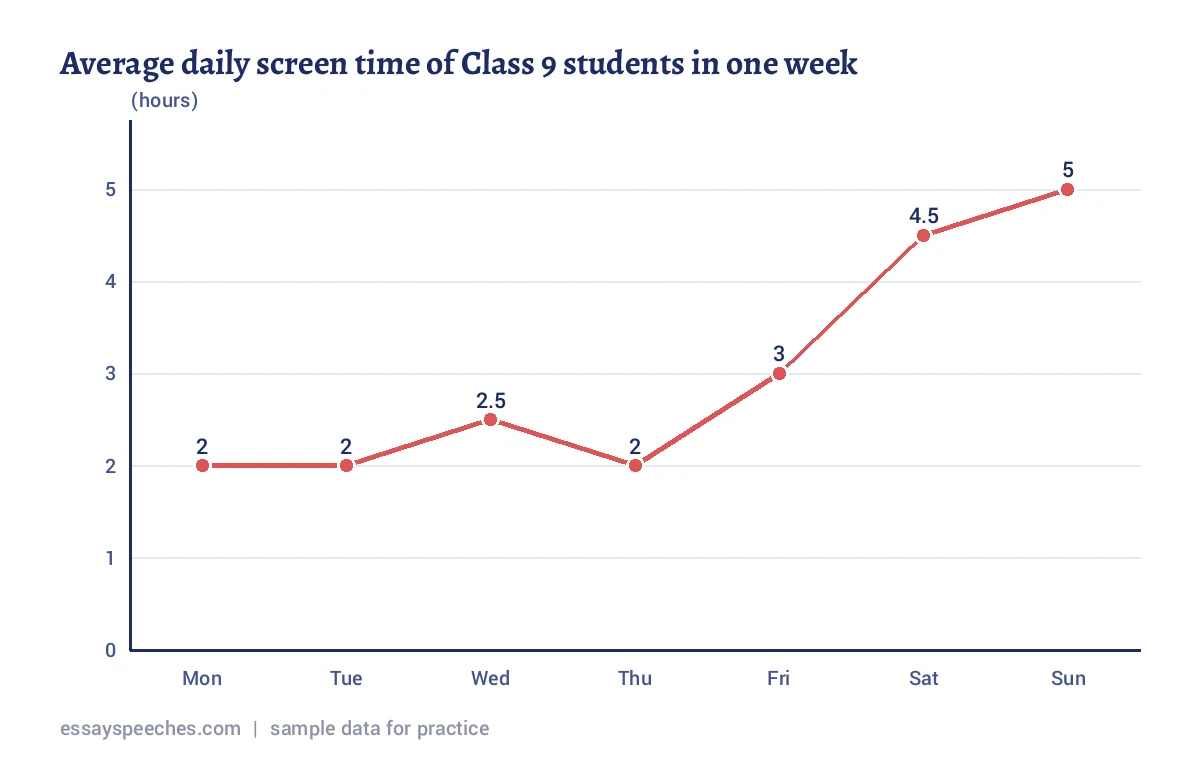
The line graph shows the average daily screen time of 200 Class 9 students, recorded through a survey of students over one week. Overall, screen use stays fairly low on school days and rises sharply at the weekend. From Monday to Thursday, the figure hovers between 2 and 2.5 hours, with a small peak of 2.5 hours on Wednesday. It climbs to 3 hours on Friday, when homework pressure eases. The steepest jump comes on Saturday, at 4.5 hours, and the highest point is Sunday, at 5 hours, which is two and a half times the Monday figure. Clearly, more free time leads to more time in front of screens. Planning outdoor games or hobbies for weekends could help students keep this habit in check.
How a Topper Answer Is Built: The Screen Time Example Explained
Look again at the screen time answer above. Each sentence has a job, and that is exactly what examiners reward when they check the format, content and organisation of an analytical paragraph.
| Part | What the sentence does | Why it earns marks |
|---|---|---|
| Sentence 1 | Names the chart type, who was surveyed (200 Class 9 students) and the period (one week). | A complete introduction with the source. |
| Sentence 2 | Gives the overview: low on school days, high at the weekend. | Shows the reader the big picture before the details. |
| Sentences 3 and 4 | Groups Monday to Thursday together, then notes the rise on Friday. | Selects data instead of listing all seven numbers one by one. |
| Sentence 5 | Picks out the highest point and compares it with Monday (two and a half times). | A correct comparison is the clearest sign of analysis. |
| Sentences 6 and 7 | States the overall link between free time and screen use, then adds one suggestion. | A short conclusion that stays close to the data. |
Notice also what the answer leaves out. It does not lecture readers about the harm of phones, it does not bring in figures from outside the chart, and it does not repeat the word "increase". Instead it uses hovers, climbs, steepest jump and highest point. Before you write your own analytical paragraph, plan these five parts in the margin with just a few words each. Then the writing takes less than eight minutes, leaving time to check every figure against the graph.
Analytical Paragraph Class 10 Pie Chart Example: Favourite Sports
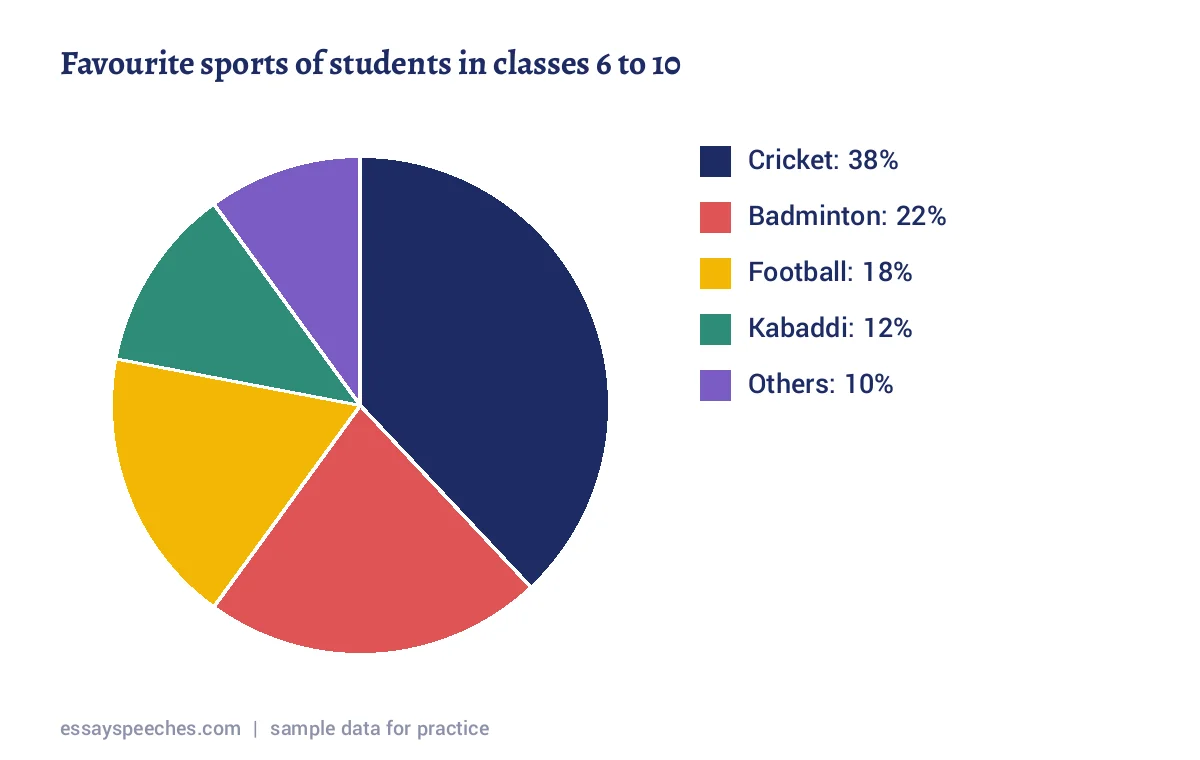
The pie chart presents the favourite sports of 500 students from classes 6 to 10, based on a survey of students in a city school. Cricket is by far the most popular game, chosen by 38 percent of the students. Badminton comes second with 22 percent, while football is close behind at 18 percent. Kabaddi, a traditional Indian game, is the favourite of 12 percent, and the remaining 10 percent prefer other sports such as kho-kho and swimming. Interestingly, cricket alone attracts more students than badminton and kabaddi put together, which add up to 34 percent. On the whole, the data suggests that a few games dominate. The school could offer better facilities for less common sports so that every student gets a fair chance to play.
Analytical Paragraph Class 10 Bar Graph: Mode of Travel to School
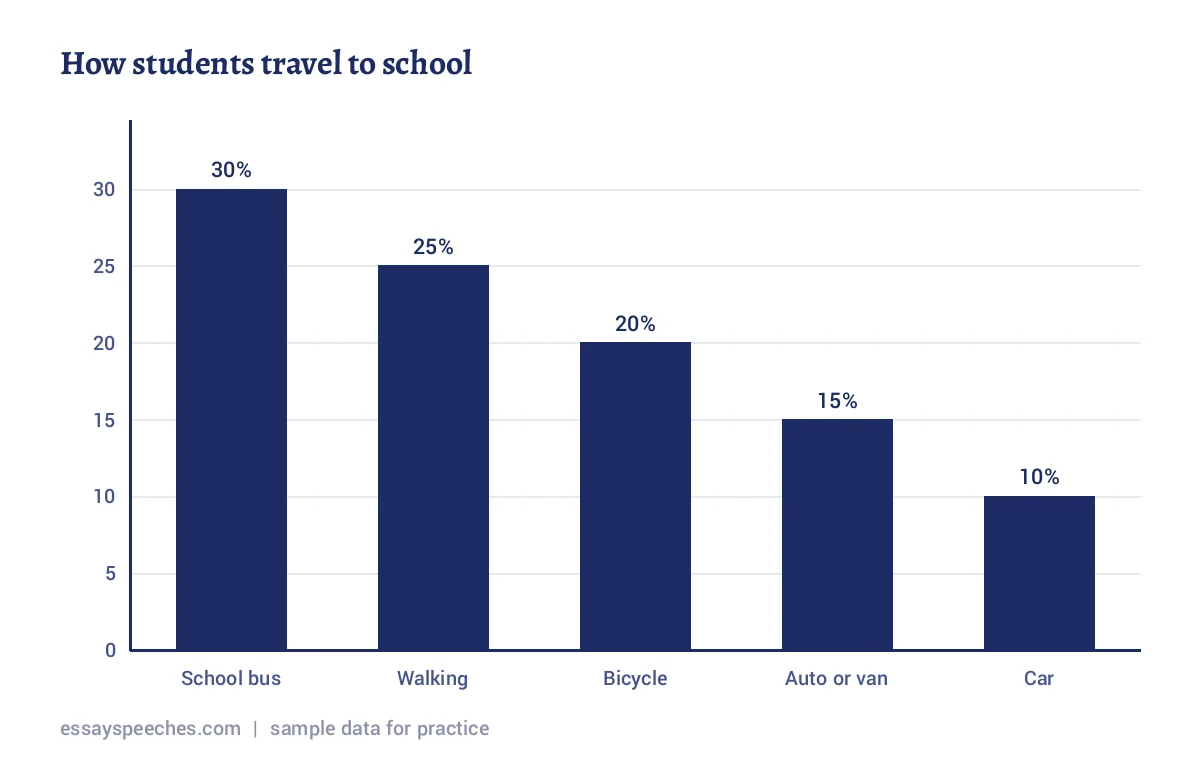
The bar graph illustrates how students reach school, according to a survey of 400 students of a school in a small town. The school bus is the most common choice, used by 30 percent of the students. Walking follows at 25 percent, and cycling at 20 percent. Autos and vans carry 15 percent, while only 10 percent come by private car, the least used mode. Taken together, nearly half the students, 45 percent, walk or cycle, which is good for both their health and the environment. In contrast, the share of car users is just one third of the bus figure. To sum up, most students depend on shared or pollution-free transport. Safe footpaths and cycle stands near the school could persuade even more families to leave the car at home.
Sample Analytical Paragraph Class 10: Reading Habits
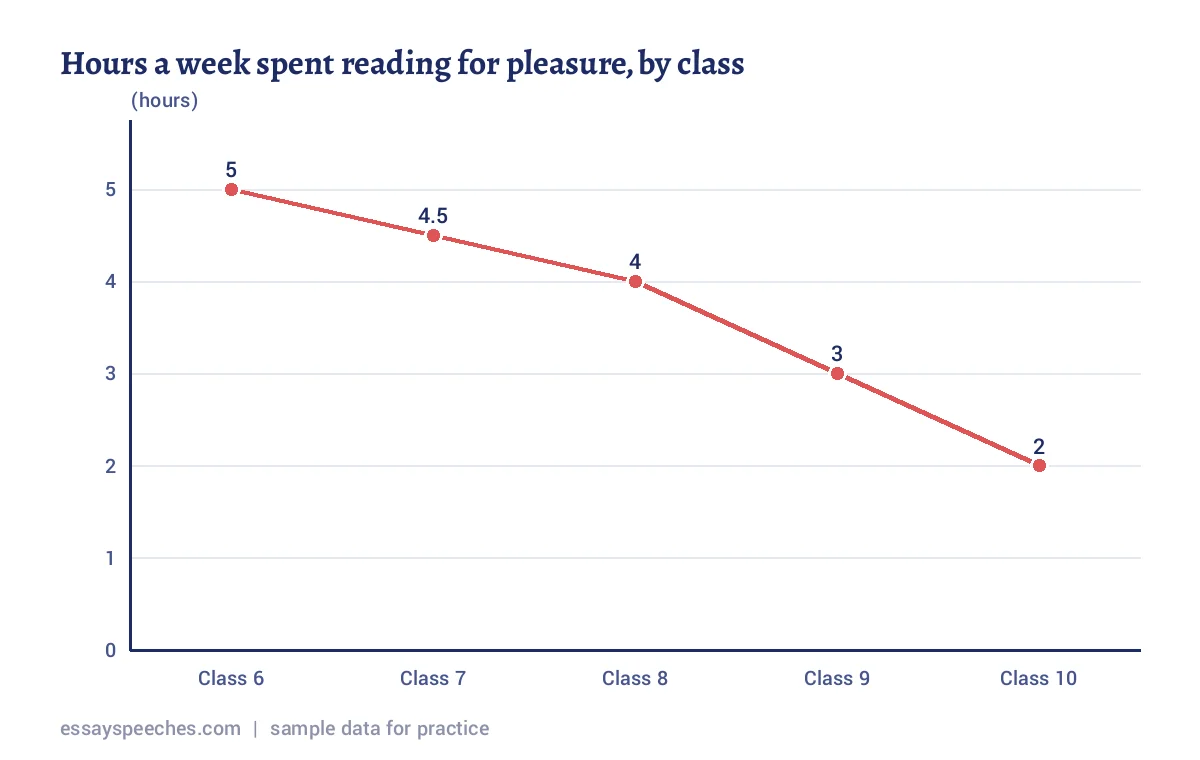
The given line graph compares the average number of hours a week that students spend reading for pleasure, from Class 6 to Class 10, as found in a survey of students. The main trend is a steady fall as students move to higher classes. Class 6 students read the most, about 5 hours a week. The figure slips gently to 4.5 hours in Class 7 and 4 hours in Class 8. After this, the decline speeds up: Class 9 students read for only 3 hours, and Class 10 students for just 2 hours, which is less than half the Class 6 figure. A likely reason is the growing load of board exam preparation and tuition classes. Schools could keep a weekly library period so that the joy of reading is not lost in the senior classes.
Analytical Paragraph Example: Water Use at Home (Bar Graph)
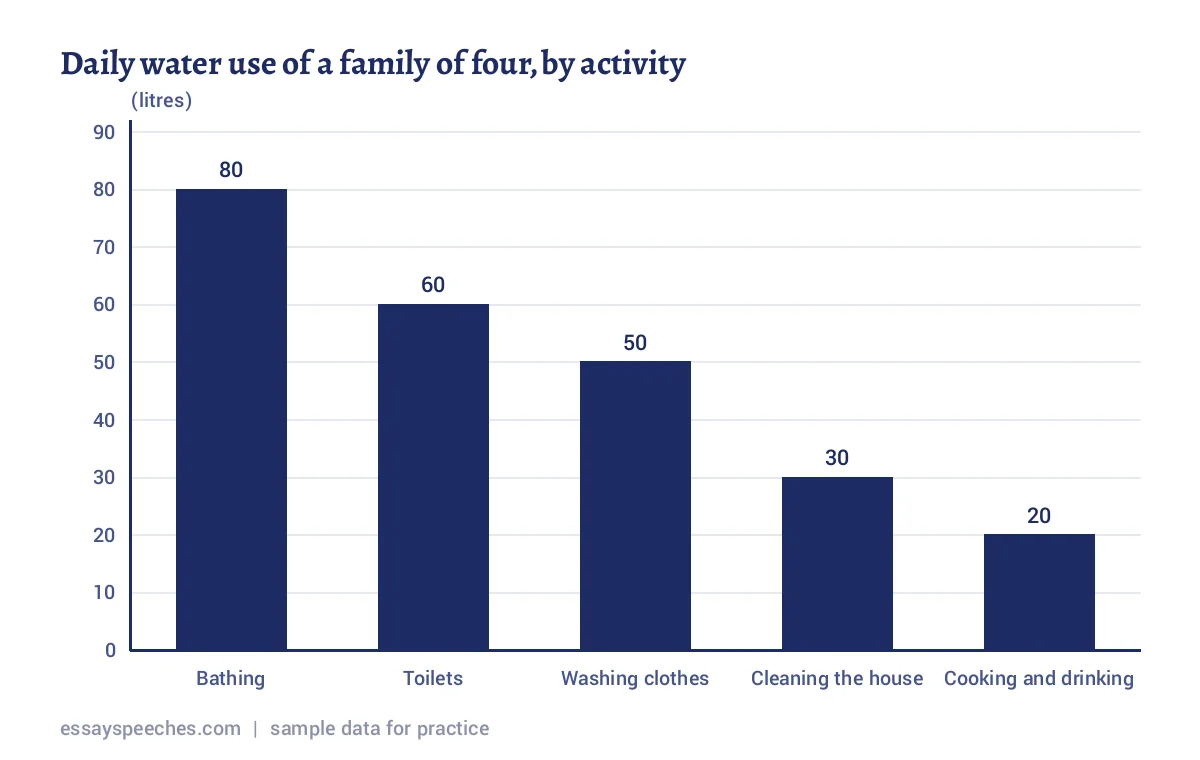
The bar chart depicts how an average family of four uses water in a day, based on a survey of students who measured the water used at home. In total, the family uses 240 litres daily. Bathing takes the largest share at 80 litres, which is one third of the total. Flushing toilets uses 60 litres, and washing clothes 50 litres. Cleaning the house needs 30 litres, while cooking and drinking, the most essential use of all, needs only 20 litres. In other words, bathing consumes four times as much water as cooking and drinking. These figures reveal that most water goes into washing tasks, where it is easiest to save. Bathing with a bucket and reusing rinse water for mopping could bring the daily total down considerably.
Analytical Paragraph Class 9 Example: Pocket Money Spending (Pie Chart)
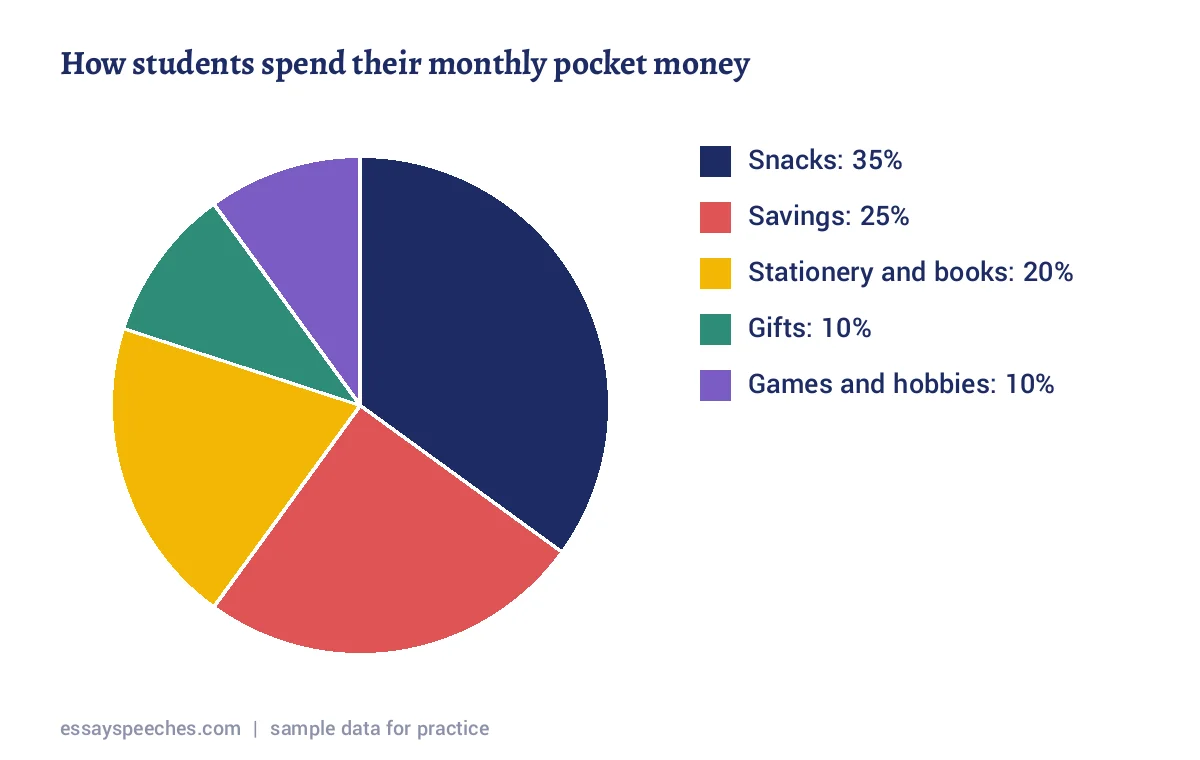
The pie chart shows how students of classes 8 to 10 spend their monthly pocket money, according to a survey of 300 students. The biggest portion, 35 percent, goes on snacks and fast food bought from the canteen and nearby shops. Encouragingly, students save 25 percent of their pocket money, which is the second largest share. Stationery and books account for 20 percent. Gifts for friends and family take 10 percent, and an equal share of 10 percent is spent on games and hobbies. It is worth noticing that snacks alone take as much money as savings and gifts combined. On the whole, the students show a sensible habit of saving. However, eating less junk food could help them save even more and stay healthier at the same time.
Analytical Paragraph Questions for Practice (Class 10 Worksheet)
Sketch each chart from the data given, then write an analytical paragraph of 100 to 120 words. Check your answer against the format and the marking points above.
- Bar graph: number of trees planted by the eco club in five months: July 40, August 65, September 30, October 20, November 45.
- Pie chart: how Class 10 students spend a holiday: studying 30 percent, sleeping 25 percent, screen time 20 percent, outdoor play 15 percent, helping at home 10 percent.
- Line graph: attendance in a school over six months: April 92 percent, May 88, July 95, August 90, September 85, October 93.
- Bar graph: favourite school subjects of 250 students: Mathematics 70, Science 60, English 45, Social Science 40, Art 35.
- Pie chart: types of waste collected in a school in one week: paper 45 percent, plastic 25 percent, food waste 20 percent, others 10 percent.
- Line graph: average hours of sleep on school nights, Class 6 to Class 12: 9, 8.5, 8.5, 8, 7, 6.5, 6.
- Bar graph: library books borrowed by type in one term: stories 120, comics 90, general knowledge 60, science 50, poetry 30.
- Table: breakfast habits of 200 students: home-cooked breakfast 110, packed snack 40, canteen 30, skip breakfast 20.
How to Write an Analytical Paragraph Class 10 Like a Topper
- Spend the first minute only on the chart: read the title, the labels and the unit before writing a word.
- Open with a precise sentence such as "The bar graph illustrates the favourite subjects of 250 students of a school." Avoid copying the question word for word.
- Give an overview line early, because examiners look for the main trend before the details.
- Use at least two comparisons, for example "twice as many as" or "one third of", and check the arithmetic before you write it.
- Vary your verbs and linkers: rose, climbed, dipped, whereas, while, in contrast, similarly.
- Keep the conclusion short and tied to the data; one reason or suggestion is enough.
- Count your words. An analytical paragraph of 100 to 120 words written neatly scores better than a crowded answer of 200 words.
Questions students ask
What is an analytical paragraph in Class 10 English?
It is a writing question in which you describe and compare data given in a bar graph, line graph, pie chart or table. You write one paragraph of 100 to 120 words with an introduction, a body with the key figures and a short conclusion.
What is the format of an analytical paragraph?
Start with an introduction that names the chart, the source and the time period, followed by an overview of the main trend. The body presents the most important figures in order with comparisons. The conclusion sums up the pattern in one or two sentences.
Should I give a title to an analytical paragraph?
A title is not compulsory in most schools, and marks depend on content, organisation and accuracy. If your teacher asks for one, keep it short, such as "Screen Time of Class 9 Students".
Which tense should I use in an analytical paragraph?
Use the present tense when describing survey results or general data, for example "38 percent of students prefer cricket". Use the past tense when the chart shows figures from past years.
How is an analytical paragraph different from a descriptive paragraph?
A descriptive paragraph paints a picture of a person, place or event using the senses. An analytical paragraph sticks to facts and numbers from a chart, compares them and points out trends, with very little personal opinion.
Every essay and speech on this page is written and checked by the Essay Speeches team. Spotted a mistake? Tell us. How we write.